
Hi there! My name is Muhammad Garebaldhie. I’m a software engineer passionate about infrastructure and cloud technologies. Following my journey in the Kubernetes world, as I keep tinkering with Kubernetes, the curiosity about Kubernetes keeps growing.
Currently, I am tinkering with Kubernetes networking and I want to share my experience with it, especially how eBPF (extended Berkeley Packet Filter) and Cilium can revolutionize Kubernetes networking, providing better performance, observability, and security. This is Day 10 of Advent Calendar 2025 series of Money Forward Engineers.
Table of Contents
- Understanding Kubernetes Networking
- What is CNI?
- The Bottleneck: Traditional Networking
- Enter eBPF: Programmable Kernel
- Cilium: Production-Ready eBPF Networking
- Cilium CNI Features
- Network Policies: Cilium vs Default
- So how to set up Cilium in your cluster?
- Bottom line
Understanding Kubernetes Networking
Let’s start with a simple example. Let’s say we have 2 services, frontend and backend. Frontend needs to communicate with backend to get the data. In this simple example, I will use Kubernetes to deploy the services in pod-to-pod-communication a namespace. Here are the details:
For backend, I will use simple http-echo server that will echo the request back to the frontend.
apiVersion: apps/v1
kind: Deployment
metadata:
  name: backend
  namespace: pod-to-pod-communication
  labels:
    app: backend
spec:
  replicas: 2
  selector:
    matchLabels:
      app: backend
  template:
    metadata:
      labels:
        app: backend
    spec:
      containers:
        - name: backend
          image: hashicorp/http-echo:latest
          args:
            - "-text=Hello from Backend Service!"
            - "-listen=:8080"
          ports:
            - containerPort: 8080
              name: http
          resources:
            requests:
              memory: "64Mi"
              cpu: "50m"
            limits:
              memory: "128Mi"
              cpu: "100m"
          livenessProbe:
            httpGet:
              path: /
              port: 8080
            initialDelaySeconds: 5
            periodSeconds: 10
          readinessProbe:
            httpGet:
              path: /
              port: 8080
            initialDelaySeconds: 5
            periodSeconds: 5
The frontend will be a simple busybox service that will call the backend service every 10 seconds. But we have a problem here. How can we call the backend service from the frontend service? What value should we put in the BACKEND_URL environment variable?
apiVersion: apps/v1
kind: Deployment
metadata:
  name: frontend
  namespace: pod-to-pod-communication
  labels:
    app: frontend
spec:
  replicas: 2
  selector:
    matchLabels:
      app: frontend
  template:
    metadata:
      labels:
        app: frontend
    spec:
      containers:
        - name: frontend
          image: busybox:latest
          command: ["/bin/sh"]
          args:
            - "-c"
            - |
              while true; do
                echo "=== Frontend calling Backend at $(date) ==="
                wget -q -O- $BACKEND_URL
                echo ""
                echo "Response received successfully!"
                sleep 10
              done
          resources:
            requests:
              memory: "32Mi"
              cpu: "25m"
            limits:
              memory: "64Mi"
              cpu: "50m"
          env:
            - name: BACKEND_URL
              value: <What should we put here????>
          stdin: true
          tty: true
Let’s jump inside the container. Maybe we can find the answer there. Let’s get the pod name first.
kubectl get pods -n pod-to-pod-communication
# NAME                       READY   STATUS    RESTARTS   AGE
# backend-79d49789f6-btv48   1/1     Running   0          13m
# backend-79d49789f6-j24bk   1/1     Running   0          13m
# frontend-698d9c754-27wmb   1/1     Running   0          10m
# frontend-698d9c754-q585m   1/1     Running   0          10m
Maybe we can use the IP of the backend service to call the backend service from the frontend service.
kubectl -n pod-to-pod-communication describe pod/backend-79d49789f6-btv48 | grep IP
# IP:               10.244.1.114
# IPs:
#   IP:           10.244.1.114
So the IP of the backend pod is 10.244.1.114. Let’s try to call the backend pod from the frontend pod. Since busybox doesn’t have curl, we can use the wget command as a replacement.
kubectl exec -it frontend-698d9c754-q585m -n pod-to-pod-communication -- /bin/sh
# / #
wget -q -O- http://10.244.1.114:8080
# Hello from Backend Service!
# / #
We can see the response from the backend pod. So that means we can use the IP of the backend pod to call the backend pod from the frontend pod, right?
Not really, because the IP of the backend pod is not stable. Every time we restart the pod or do any changes to the pod, the IP will change. This is what we call an ephemeral IP because it is not guaranteed to be the same.
So we can’t use the IP of the backend pod to call the backend from the frontend pod. What should we do? Fortunately, Kubernetes has a solution for this. Service object in Kubernetes is a way to provide a stable endpoint for a group of pods.
Let’s create a service object for both services.
# Backend Service
apiVersion: v1
kind: Service
metadata:
  name: backend
  namespace: pod-to-pod-communication
  labels:
    app: backend
spec:
  selector:
    app: backend
  ports:
    - name: http
      port: 8080
      targetPort: 8080
      protocol: TCP
  type: ClusterIP
---
# Frontend Service
apiVersion: v1
kind: Service
metadata:
  name: frontend
  namespace: pod-to-pod-communication
  labels:
    app: frontend
spec:
  selector:
    app: frontend
  ports:
    - name: http
      port: 80
      targetPort: 8080
      protocol: TCP
  type: ClusterIP
After we create the service object, let’s check the service object.
kubectl get service -n pod-to-pod-communication
# NAME       TYPE        CLUSTER-IP   EXTERNAL-IP   PORT(S)   AGE
# backend    ClusterIP   10.96.0.1     <none>        8080/TCP  10m
# frontend   ClusterIP   10.96.0.2     <none>        80/TCP    10m
So the service object for the backend service is backend and the service object for the frontend service is frontend. As you can see service object has a ClusterIP. So now we should be able to call the backend service from the frontend service by using the ClusterIP of the backend service.
Let’s execute wget command from the frontend pod again.
wget -q -O- http://10.102.212.194:8080
# Hello from Backend Service!
# / #
Our theory worked so far! But I think it’s really difficult to remember the ClusterIP of the service object. What if we can use the service name instead of the ClusterIP?
Let’s try to call the backend service from the frontend service by using the service name.
wget -q -O- http://backend:8080
# Hello from Backend Service!
# / #
It worked! But how? Let’s try to dig deeper. Usually we need to have the IP, but in this case we can use backend as a hostname to call the backend service. Eventually CoreDNS will resolve the backend hostname to the ClusterIP of the backend service. We can check the DNS resolution by using the nslookup command.
nslookup backend
# Server:         10.96.0.10
# Address:        10.96.0.10:53

# ** server can't find backend.cluster.local: NXDOMAIN

# Name:   backend.pod-to-pod-communication.svc.cluster.local
# Address: 10.102.212.194

# ** server can't find backend.svc.cluster.local: NXDOMAIN

# ** server can't find backend.cluster.local: NXDOMAIN

# ** server can't find backend.svc.cluster.local: NXDOMAIN
We can see the ClusterIP of the backend service is 10.102.212.194. But how can CoreDNS resolve the hostname to IP address? This is where CoreDNS comes in. CoreDNS is a DNS server that is used to resolve the hostname to IP address. It is a component of the Kubernetes cluster that is responsible for resolving the hostname to IP address. Every time a new pod is created, Kubernetes API will update the CoreDNS with the new pod IP address. As you can see in the image below, kube-dns is equivalent to CoreDNS.
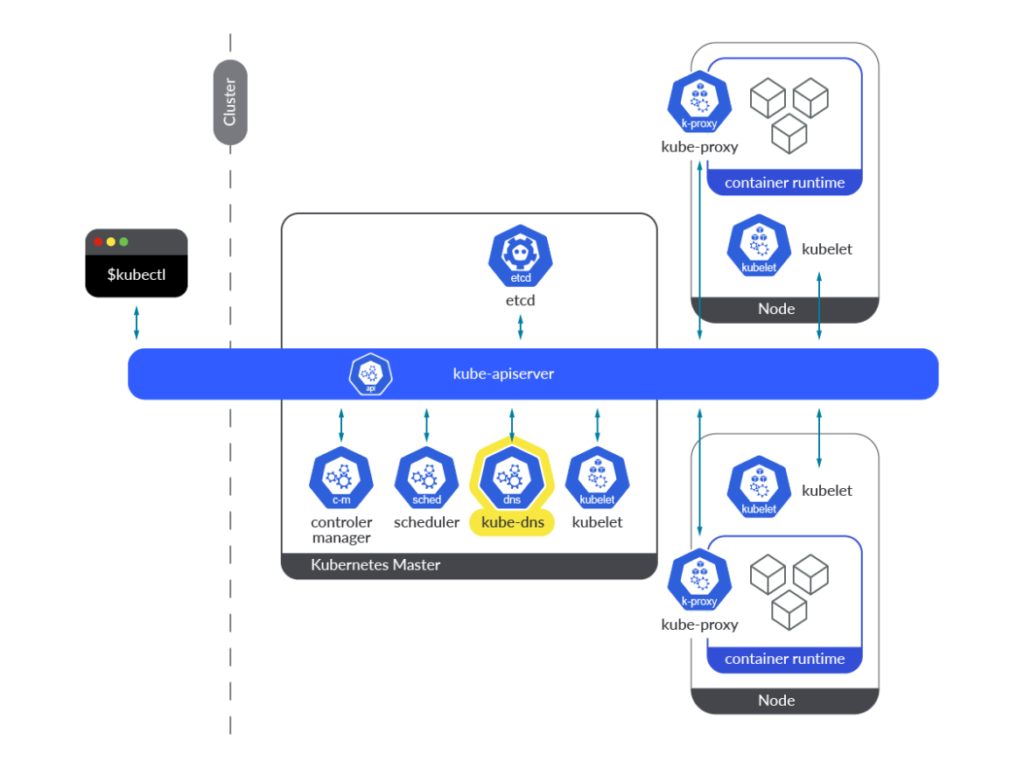
Image from sysdig
CoreDNS will try to resolve the hostname with the following order:
pod-to-pod-communication.svc.cluster.localsvc.cluster.localcluster.local
Usually it will be <backend-name>.<namespace-name>.svc.cluster.local and then followed by the svc.cluster.local and cluster.local domains.
cat /etc/resolv.conf
# search pod-to-pod-communication.svc.cluster.local svc.cluster.local cluster.local
# nameserver 10.96.0.10
# options ndots:5
But how can CoreDNS find the right IP address for the hostname? If we take a look at the backend deployment, we can see that it has more than one pod. How can CoreDNS know which pod to use?
The cluster IP that we just saw is actually a Virtual IP (VIP) that is managed by kube-proxy. kube-proxy is a component of the Kubernetes cluster that is responsible for managing the network traffic to the pods.
When a packet arrives at the VIP, kube-proxy uses iptables/nftables rules to map the VIP to the actual pod IP addresses. Let’s take a look at the iptables rules for the backend service.
kubectl -n kube-system get pod -l k8s-app=kube-proxy
# NAME               READY   STATUS    RESTARTS      AGE
# kube-proxy-cdggq   1/1     Running   3 (25d ago)   85d
# kube-proxy-mhn2k   1/1     Running   2 (25d ago)   85d
kubectl -n kube-system exec -it pod/kube-proxy-mhn2k -- /bin/sh
Let’s check the IP tables! (Note, newer kubeproxy use nftables instead of iptables)
nft list ruleset | grep -A 5 pod-to-pod-communication
# # nft list ruleset | grep -A 5 pod-to-pod-communication
# # Warning: table ip mangle is managed by iptables-nft, do not touch!
#                              10.99.27.172 . tcp . 80 : goto service-QG7T3HP5-pod-to-pod-communication/frontend/tcp/http,
#                              10.102.212.194 . tcp . 8080 : goto service-2SSYTHNH-pod-to-pod-communication/backend/tcp/http,
# --
# {
#
# (..snipped..)
#
#         chain service-QG7T3HP5-pod-to-pod-communication/frontend/tcp/http {
#                 ip daddr 10.99.27.172 ip saddr != 10.244.0.0/16 jump mark-for-masquerade
#                 numgen random mod 2 vmap { 0 : goto endpoint-4AQA3P2Y-pod-to-pod-communication/frontend/tcp/http__10.244.1.117/8080, 1 : goto endpoint-WH3JQAJZ-pod-to-pod-communication/frontend/tcp/http__10.244.1.195/8080 }
#         }

#         chain service-2SSYTHNH-pod-to-pod-communication/backend/tcp/http {
#                 ip daddr 10.102.212.194 ip saddr != 10.244.0.0/16 jump mark-for-masquerade
#                 numgen random mod 2 vmap { 0 : goto endpoint-L6UGOR6Q-pod-to-pod-communication/backend/tcp/http__10.244.1.114/8080, 1 : goto endpoint-YX4ZWMQY-pod-to-pod-communication/backend/tcp/http__10.244.1.89/8080 }
#         }

#         chain endpoint-L6UGOR6Q-pod-to-pod-communication/backend/tcp/http__10.244.1.114/8080 {
#                 ip saddr 10.244.1.114 jump mark-for-masquerade
#                 meta l4proto tcp dnat to 10.244.1.114:8080
#         }

#         chain endpoint-YX4ZWMQY-pod-to-pod-communication/backend/tcp/http__10.244.1.89/8080 {
#                 ip saddr 10.244.1.89 jump mark-for-masquerade
#                 meta l4proto tcp dnat to 10.244.1.89:8080
#         }

#         chain endpoint-4AQA3P2Y-pod-to-pod-communication/frontend/tcp/http__10.244.1.117/8080 {
#                 ip saddr 10.244.1.117 jump mark-for-masquerade
#                 meta l4proto tcp dnat to 10.244.1.117:8080
#         }

#         chain endpoint-WH3JQAJZ-pod-to-pod-communication/frontend/tcp/http__10.244.1.195/8080 {
#                 ip saddr 10.244.1.195 jump mark-for-masquerade
#                 meta l4proto tcp dnat to 10.244.1.195:8080
#         }
# }
Let’s collect key information from the iptables rules:
10.102.212.194is the VIP of the backend service.service-2SSYTHNH-pod-to-pod-communication/backend/tcp/httpis the chain name of the backend service.goto service-2SSYTHNH-pod-to-pod-communication/backend/tcp/httpis the rule that will forward the request to the backend service.numgen random mod 2 vmap { 0 : goto endpoint-L6UGOR6Q-pod-to-pod-communication/backend/tcp/http__10.244.1.114/8080, 1 : goto endpoint-YX4ZWMQY-pod-to-pod-communication/backend/tcp/http__10.244.1.89/8080 }is the rule that will forward the request to one of the backend pods.
So let me summarize the process:
- The request is forwarded to the VIP of the backend service.
- The Virtual IP is mapped to the backend service by using the following rule:
10.102.212.194 . tcp . 8080 : goto service-2SSYTHNH-pod-to-pod-communication/backend/tcp/http,<br>- Inside the service chain, the request is forwarded to one of the backend pods by using the
numgen random mod 2 vmaprule. So we use probability to choose the backend pod. In this case, we have 2 backend pods, so we use 50% probability to choose the backend pod.
#         chain service-2SSYTHNH-pod-to-pod-communication/backend/tcp/http {
#                 ip daddr 10.102.212.194 ip saddr != 10.244.0.0/16 jump mark-for-masquerade
#                 numgen random mod 2 vmap { 0 : goto endpoint-L6UGOR6Q-pod-to-pod-communication/backend/tcp/http__10.244.1.114/8080, 1 : goto endpoint-YX4ZWMQY-pod-to-pod-communication/backend/tcp/http__10.244.1.89/8080 }
#         }
- After the number has been picked, the request is forwarded to the endpoint chain by using the
goto endpoint-L6UGOR6Q-pod-to-pod-communication/backend/tcp/http__10.244.1.114/8080orgoto endpoint-YX4ZWMQY-pod-to-pod-communication/backend/tcp/http__10.244.1.89/8080rule. - Finally, the request is forwarded to the backend pod by using the
meta l4proto tcp dnat torule to the backend pod with the correct IP address and port.
#         chain endpoint-L6UGOR6Q-pod-to-pod-communication/backend/tcp/http__10.244.1.114/8080 {
#                 ip saddr 10.244.1.117 jump mark-for-masquerade
#                 meta l4proto tcp dnat to 10.244.1.117:8080
#         }
Note: nftables are used for newer Kubernetes versions. iptables are used for older Kubernetes versions.
nftables is more efficient since it uses hash maps for service lookup whereas iptables uses linear search. In iptables service lookup is done by scanning the ruleset sequentially not using goto statements.
Now we know how Kubernetes networking works! Give yourself a pat on the back!
While all of those things are done by kube-proxy, not only kube-proxy is responsible for the networking. We also need to have a network plugin to manage the networking. The IP that was assigned to the pod earlier and routing the traffic to the pod is done by the network plugin. We call this network plugin CNI (Container Network Interface).
What is CNI?
CNI (Container Network Interface) is a specification and library for writing plugins to configure network interfaces in Linux containers. It’s the standard way Kubernetes manages networking.
A CNI plugin is responsible for:
- IP Address Management: Assigning IP addresses to pods
- Network Configuration: Setting up routes and network interfaces
- Pod Lifecycle Management: Adding/removing network interfaces when pods are created/destroyed
Popular CNI Plugins
If you notice from the previous example, we can see flannel is used. Flannel is a simple overlay network using VXLAN that is used by default in some of Kubernetes distributions such as k3s and talos. If you want to know more about Flannel, you can read the Flannel documentation.
Note:
By default, If you install Kubernetes manually using kubeadm CNI is not installed by default, so you need to install it manually.
Here are some of the popular CNI plugins:
- Flannel: Simple overlay network using VXLAN
- Calico: BGP-based networking with network policies
- Weave: Encrypted mesh networking
- Cilium: eBPF-based networking (our focus today)
Each CNI plugin has different characteristics in terms of performance, features, and complexity. But in this article, we will focus on Cilium, because it is the one of the most popular CNI plugin for Kubernetes and it is also the most powerful one.
The Bottleneck: Traditional Networking
Traditional Kubernetes networking relies heavily on iptables (Older versions) or nftables (Newer versions) for service proxying. Let’s understand why this becomes a problem at scale.
The O(N) Problem in kube-proxy
Modern kube-proxy with nftables already improves the performance by using maps for service lookup, which provides O(1) packet processing compared to iptables that provide O(N) packet processing. However, the O(N) bottleneck appears when endpoints change:
- Rule Updates: O(N) – When a pod is added/removed, kube-proxy must:
- Regenerate the
vmapwith recalculated probabilities for all N endpoints - Update all endpoint chains
- Rebuild map structures
syncProxyRules()function regenerates all rules for affected services when endpoints change – Sookocheff – Leveraging eBPF in Kubernetes - Regenerate the
- Rule Generation: O(N) – Creating rules scales linearly with endpointsIn large clusters with thousands of services, updating iptables rules can take hours. The sequential nature of rule evaluation leads to O(N) complexity – Tigera – Turbocharge Kubernetes with eBPF.
Real-World Impact
In a production environment with hundreds of services and thousands of pods, this becomes a significant bottleneck:
- Increased Latency: More time spent in kernel space evaluating rules
- Higher CPU Usage: Constant rule evaluation consumes CPU cycles
- Scalability Limits: Performance degrades as the cluster grows
Enter eBPF: Programmable Kernel
So we’ve seen how kube-proxy works with nftables. But what if we can make the kernel itself programmable? That’s where eBPF comes in.
eBPF stands for extended Berkeley Packet Filter. It’s a way to run programs directly in the Linux kernel without modifying the kernel source code or rebooting the system.
What is eBPF?
Think of it this way: instead of having static rules like iptables, eBPF lets you write programs that run in the kernel. These programs can hook into different points in the kernel – like when a packet arrives, or when a system call happens.
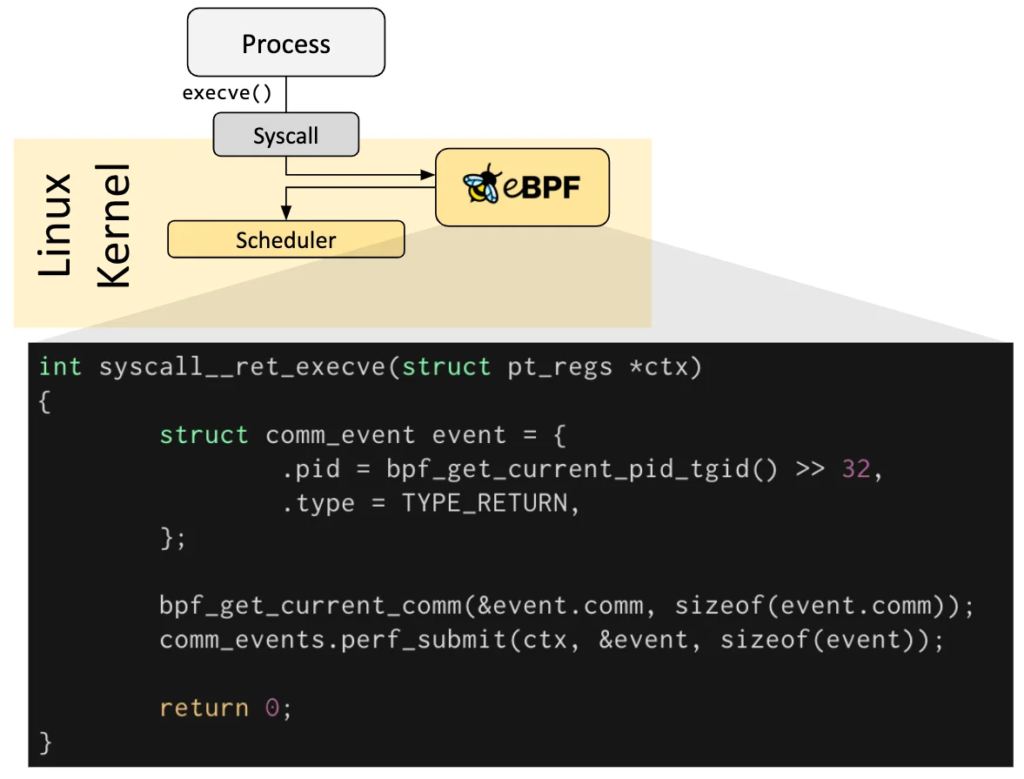
Image from ebpf.io
The key parts of eBPF are:
- Hooks: These are places in the kernel where you can attach your eBPF program
- Network packet processing
- System calls
- Kernel functions
- Tracepoints
- Maps: This is how eBPF programs share data with userspace applications
- Hash maps (like a dictionary)
- Array maps
- Per-CPU maps
- Safety: Before an eBPF program runs, the kernel verifies it
- Makes sure it won’t crash the kernel
- Prevents infinite loops
- Validates memory access
So instead of having static rules that need to be updated every time something changes, eBPF lets you write dynamic programs that can adapt on the fly.
Cilium: Production-Ready eBPF Networking
So we know eBPF can solve our networking problem. But how do we actually use it in Kubernetes? That’s where Cilium comes in.
Cilium is a CNI plugin that uses eBPF for Kubernetes networking. Instead of using kube-proxy with iptables, Cilium uses eBPF programs to handle service load balancing and routing. As you can see in the image below, Cilium is more efficient than kube-proxy because it skips the iptables/nftables rules and goes straight to the eBPF program.

How Cilium Works
Remember how kube-proxy works? When a packet arrives at a service’s Virtual IP, it goes through iptables/nftables rules to find the right pod. With Cilium, it’s different:
- Packet arrives at Virtual IP (same as before)
- eBPF program intercepts the packet in the kernel
- Looks up the service in an eBPF hash map (O(1) lookup!)
- Gets the backend pod IPs from the map
- Routes the packet directly to the pod
The key difference is that instead of evaluating iptables rules linearly, Cilium uses hash maps. So when you have 1000 pods, it’s still just one hash map lookup – constant time, regardless of how many pods you have.
This means:
- Faster packet processing: O(1) instead of O(N)
- No rule regeneration: When endpoints change, Cilium just updates the hash map entry (O(1)), not all the rules
- Better performance at scale: The bigger your cluster, the bigger the performance difference
Let’s See It in Action
Want to see this for yourself? If you have Cilium installed, you can check the eBPF maps directly. Let’s see how Cilium stores services:
kubectl get pods -n kube-system | grep cilium
# cilium-crjfv                            1/1     Running   0             2d5h
# cilium-envoy-glxhq                      1/1     Running   0             25d
# cilium-envoy-knh6k                      1/1     Running   0             25d
# cilium-jslrk                            1/1     Running   0             2d5h
# cilium-operator-6b565f556c-4j2xj        1/1     Running   0             25d
# cilium-operator-6b565f556c-c4cls        1/1     Running   0             25d
# Now let's see the services in eBPF maps
kubectl -n kube-system exec -it cilium-crjfv -- /bin/sh
We’re inside the Cilium pod. Let’s see the services and eBPF maps.
cilium service list
# ID   Frontend                  Service Type   Backend
# 49   10.107.170.103:80/TCP     ClusterIP      1 => 10.244.1.251:3000/TCP (active)
# 50   10.110.210.8:8080/TCP     ClusterIP      1 => 10.244.1.236:8080/TCP (active)
# 51   10.102.212.194:8080/TCP   ClusterIP      1 => 10.244.1.89:8080/TCP (active)
# ^^^^ This is our backend service
#                                               2 => 10.244.1.114:8080/TCP (active)
# 52   10.99.27.172:80/TCP       ClusterIP      1 => 10.244.1.117:8080/TCP (active)
#                                               2 => 10.244.1.195:8080/TCP (active)
# ^^^^ This is our frontend service
See that? The service 10.102.212.194:8080 is stored in an eBPF map with its backend pods. When a packet arrives, Cilium just does a hash map lookup – no linear rule evaluation needed!
You can also check the eBPF load balancer maps directly:
cilium bpf lb list
# SERVICE ADDRESS               BACKEND ADDRESS (REVNAT_ID) (SLOT)
# 10.99.27.172:80/TCP (2)       10.244.1.195:8080/TCP (52) (2)
# 10.99.27.172:80/TCP (1)       10.244.1.117:8080/TCP (52) (1)
# 10.102.212.194:8080/TCP (1)   10.244.1.89:8080/TCP (51) (1)
# 10.102.212.194:8080/TCP (2)   10.244.1.114:8080/TCP (51) (2)
# 10.110.210.8:8080/TCP (0)     0.0.0.0:0 (50) (0) [ClusterIP, non-routable]
# 10.102.212.194:8080/TCP (0)   0.0.0.0:0 (51) (0) [ClusterIP, non-routable]
# 10.103.98.139:8080/TCP (0)    0.0.0.0:0 (25) (0) [ClusterIP, non-routable]
Compare this to kube-proxy – instead of hundreds of nftables rules, Cilium just has a simple hash map. When you add or remove a pod, Cilium just updates that one map entry. No need to regenerate all the rules!
Cilium CNI Features
While we’ve seen how Cilium uses eBPF for efficient service load balancing, that’s just one piece of what makes Cilium powerful. Cilium provides a comprehensive set of features that leverage eBPF’s capabilities to enhance Kubernetes networking and security:
- Service Load Balancing: As we’ve explored, Cilium uses eBPF maps for O(1) service lookups instead of linear rule evaluation
- Network Policies: Advanced network policies with L3/L4 and L7 (application layer) support, enforced efficiently through eBPF
- Transparent Encryption: Automatic encryption of pod-to-pod traffic without requiring application changes
- Multi-Cluster Networking: Seamless connectivity between Kubernetes clusters
- Bandwidth Management: Traffic shaping and bandwidth limiting at the kernel level
- Observability: Deep visibility into network traffic through Hubble, Cilium’s observability platform
While all of these features are impressive, in this article we’ll focus on two that demonstrate the power of eBPF particularly well: Network Policies and Hubble observability. These features showcase how eBPF enables both security enforcement and deep visibility into network behavior.
Network Policies: Cilium vs Default
Let’s compare Cilium Network Policies with standard Kubernetes Network Policies.
What is Network Policy?
Just like real world traffic on the highway, the Internet also has traffic! We can control the traffic flow by using Network Policies. For example, we can allow traffic from pods with label app: frontend to port 8080 but block traffic from pods with label app: backend to port 8080.
Why do we need this? Imagine someone is breaking into your pod and starting to do some damage to the pod. If you don’t have Network Policies, the attacker can easily find the other pods in the same node and start to attack them. But if you have Network Policies, you can block the traffic from the attacker’s pod to the other pods and only allow the traffic to the pods that you want to allow.
Standard Kubernetes Network Policies
We have two types of network policies, ingress and egress. Ingress is the traffic that is coming into the pod and egress is the traffic that is going out from the pod. Kubernetes Network Policies work at L3/L4 (IP and port level). You can say “allow traffic from pods with label X to port Y”, but that’s about it:
In this example, we will deny all the traffic to the pods with label app: backend. This means that no other pods can access the pods with label app: backend.
apiVersion: networking.k8s.io/v1
kind: NetworkPolicy
metadata:
  name: backend-deny-all
  namespace: pod-to-pod-communication
spec:
  podSelector:
    matchLabels:
      app: backend
  policyTypes:
    - Ingress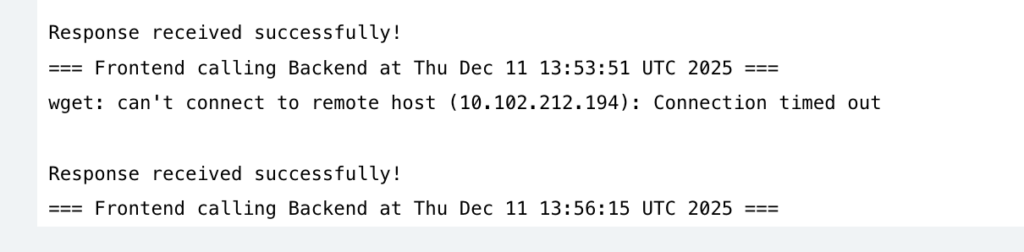
By default we have deny all traffic, so to whitelist the frontend, we need to modify the network policy to allow the traffic from the pods with label app: frontend to the pods with label app: backend. Here is the modified network policy:
apiVersion: networking.k8s.io/v1
kind: NetworkPolicy
metadata:
  name: backend-deny-all
  namespace: pod-to-pod-communication
spec:
  podSelector:
    matchLabels:
      app: backend
  policyTypes:
    - Ingress
  ingress:
    - from:
        - podSelector:
            matchLabels:
              app: frontend
      ports:
        - protocol: TCP
          port: 8080
So with this, we whitelist the traffic from the pods with label app: frontend to the pods with label app: backend on port 8080.
Sounds good, but what if we want to allow the traffic from the pods with label app: frontend to the pods with label app: backend on port 8080 but only for the GET requests to /api/v1/users and POST requests to /api/v1/orders? Or can we use network policy and apply it cluster wide? This is where normal Kubernetes network policy falls short.
Cilium Network Policies
Cilium Network Policies add L7 (Layer 7) capabilities. This means you can filter based on HTTP methods, paths, headers, and even DNS names also we can apply it cluster wide. So now we can do filtering on L3, L4 and L7. This is an example of Cilium Network Policy on L7.
apiVersion: "cilium.io/v2"
kind: CiliumNetworkPolicy
metadata:
  name: backend-allow-frontend
  namespace: pod-to-pod-communication
spec:
  endpointSelector:
    matchLabels:
      app: backend
  ingress:
    - fromEndpoints:
        - matchLabels:
            app: frontend
      toPorts:
        - ports:
            - port: "8080"
              protocol: TCP
          rules:
            http:
              - method: "POST"
                path: "/"
                headers:
                  - "Content-Type: application/json"
Now you can say “only allow POST requests to / with Content-Type header set to application/json“. Much more granular control! You can also filter based on DNS, FQDN, and many more!
Hubble: Network Observability
Sometimes we are unsure about what’s happening in the network. Does our network policy work? Do we have network latency? Are we leaking data to the internet? etc. This is where Hubble comes in.
Hubble is Cilium’s network observability platform, providing deep visibility into network traffic. Hubble uses eBPF to capture network events without modifying applications or adding sidecars. The cool thing is, it gives you complete visibility into your network traffic – who’s talking to whom, what’s being blocked, latency between services, and more.
Hubble Features
Hubble provides a lot of features to help monitor what’s happening in the network. One of the most important features is the Service Map! Service Map is a graphical view of which services communicate with each other, traffic volume, and policy enforcement status. To enable it we can use the following command:
Key Benefits
With Hubble, you can answer important questions:
- Who is talking to whom? – Complete network topology
- What traffic is being blocked? – Policy violations
- What’s the latency between services? – Performance insights
- Which pods are generating the most traffic? – Resource usage
This is super useful for security (detecting unauthorized access), troubleshooting (why services can’t communicate), and optimization (finding performance bottlenecks)
hubble ui
# or
cilium hubble ui
Note:
You need to have Hubble enabled in your cluster to use the Service Map. See this documentation about setting up Hubble
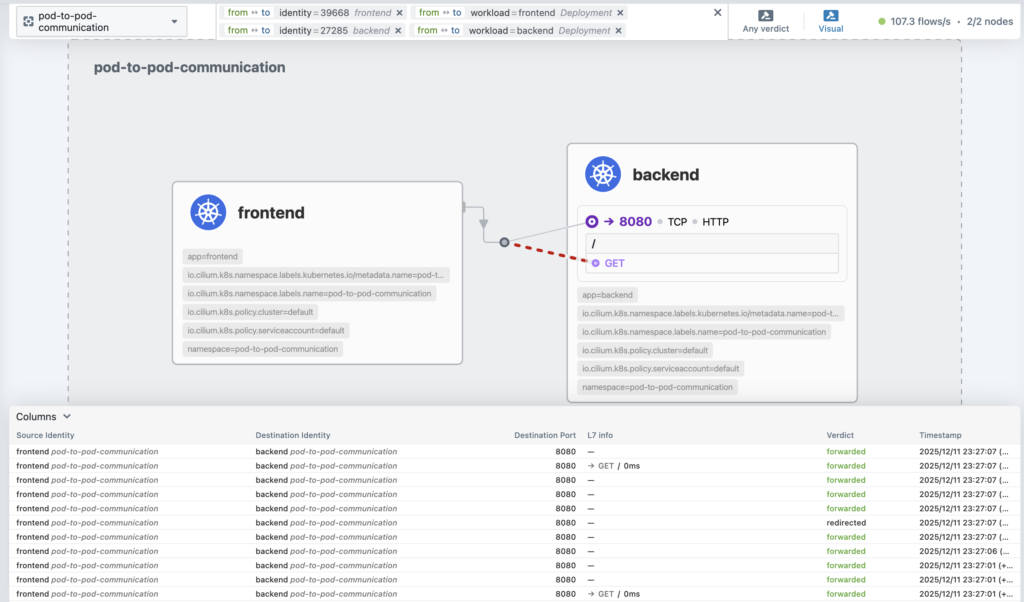
This gives you a graphical view of which services communicate with each other, traffic volume, and policy enforcement status. So let’s go see the service map and see our previous network policy in action.
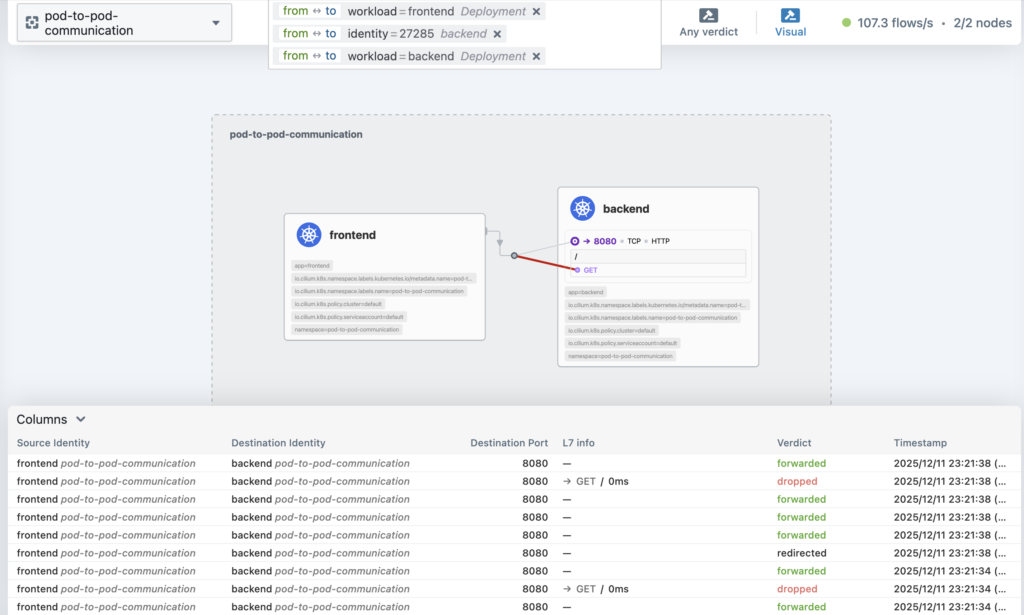
As you can see the traffic is being dropped. This is because we don’t allow the GET request, only POST to /
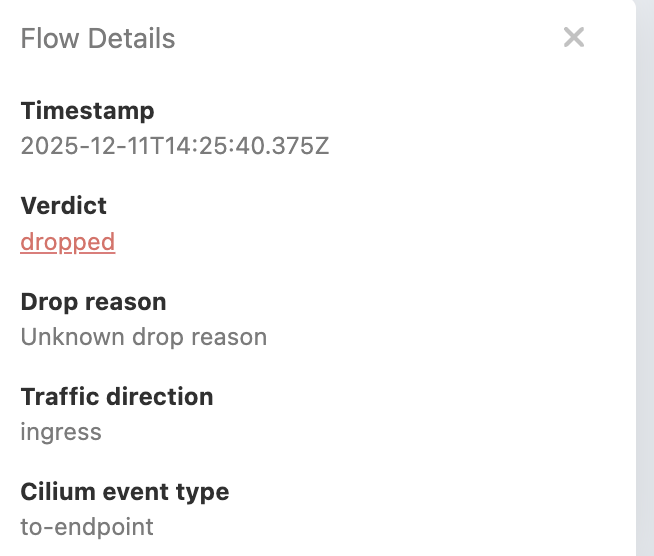
Let’s add the GET request to the network policy to allow the traffic.
apiVersion: "cilium.io/v2"
kind: CiliumNetworkPolicy
metadata:
  name: backend-allow-frontend
  namespace: pod-to-pod-communication
spec:
  endpointSelector:
    matchLabels:
      app: backend
  ingress:
    - fromEndpoints:
        - matchLabels:
            app: frontend
      toPorts:
        - ports:
            - port: "8080"
              protocol: TCP
          rules:
            http:
              - method: "GET"
                path: "/"
              - method: "POST"
                path: "/"
                headers:
                  - "Content-Type: application/json"
Now we can see the traffic is allowed.
Metrics and Monitoring
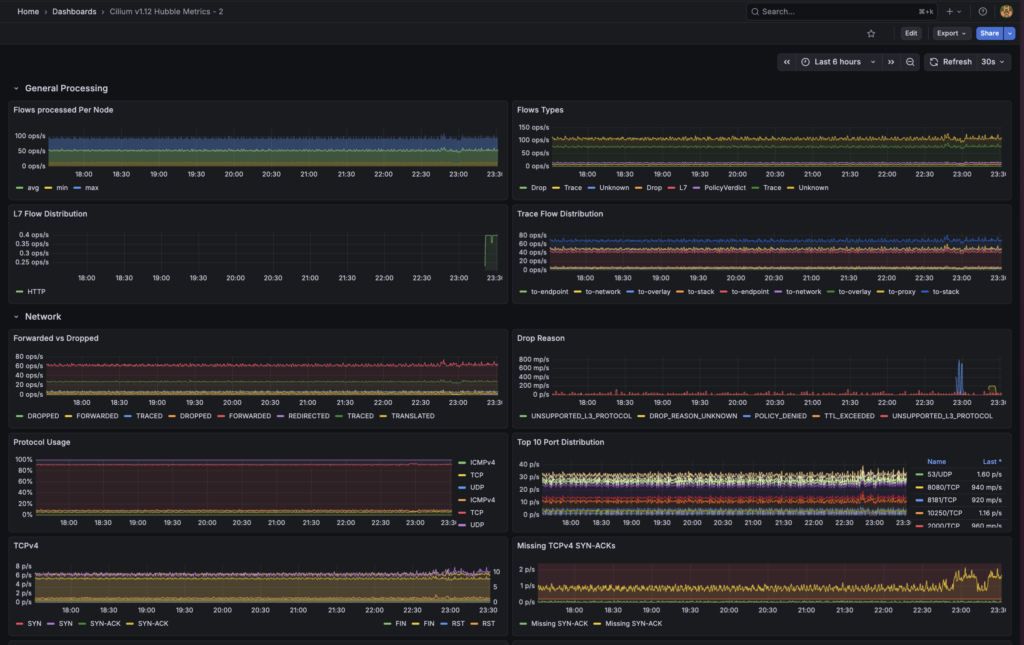
Hubble exports Prometheus metrics like hubble_flows_processed_total and hubble_policy_verdicts_total, so you can monitor network traffic and policy decisions in your existing monitoring setup. This is better than standard exporters, because they install agents to the pods to collect the metrics. While hubble doesn’t.
I set up a simple grafana dashboard to monitor the network traffic and I picked a dashboard that I found in grafana community. It shows network traffic like why the network is dropped, latency, flow and etc!
To sum up, what’s the difference
So what’s the actual difference between standard Network Policies and Cilium Network Policies? Here’s a quick comparison:
| Feature | Standard NetworkPolicy | Cilium NetworkPolicy |
|---|---|---|
| Enforcement | iptables (O(N)) | eBPF (O(1)) |
| L7 Support | ❌ | ✅ |
| DNS Policies | ❌ | ✅ |
| Performance | Degrades with scale | Constant performance |
| Observability | Limited | Rich (via Hubble) |
The key advantages of Cilium Network Policies are L7 filtering (you can filter by HTTP methods, paths, and headers), DNS policies (allow/deny based on FQDN), identity-based security (works even when pods get new IPs), and better performance (O(1) enforcement that doesn’t degrade as your cluster scales). Plus, you can still use the standard NetworkPolicy API if you want, so migration is easier.
At the end of the day, eBPF changes how we handle kernel-level networking. Instead of static iptables rules, we now have programmable kernel behavior. This gives us better performance, deep observability with Hubble, more granular security with L7 capabilities, and scalability that doesn’t degrade as clusters grow. Cilium brings all of this to Kubernetes in a way that’s actually usable in production. If you’re dealing with network performance issues, want better observability, or need more advanced security policies, Cilium is worth checking out.
So how to setup Cilium in your cluster?
Since I’m using talos as my Kubernetes flavor, we can use the talosctl to setup Cilium. The configuration is pretty simple you can follow along the documentation for more details
Step 1: Apply Cilium config to our cluster
Since I already have the cluster, what I need is not to generate new config but only to patch it. We can use this following yaml and command to patch the cluster. This will tell talos to disable kube-proxy and remove current cni plugin flannel.
cluster:
  network:
    cni:
      name: none
  proxy:
    disabled: true
After this we can patch the cluster by doing
talosctl --talosconfig talosconfig patch machineconfig -p @../talos/cilium.yaml -n 192.168.1.57,192.168.1.13Note:
You need to have the correct talosctl installed and correct talosconfig file. Make sure to change the IP address to the IP of your cluster.
Step 2: Install Cilium
After we remove our CNI, we can install Cilium to our cluster. They recommend to use helm to install Cilium. Add cilium to your helm repositories and install it. I’d like to do a 2 step method, first I generate the manifest by helm templating and apply it manually via kubectl apply -f.
helm repo add cilium https://helm.cilium.io/Generate the manifest by helm templating. Make sure to enable the Hubble and enable the Service Map.
helm template \
cilium \
cilium/cilium \
--version 1.18.4 \
--namespace kube-system \
--set ipam.mode=kubernetes \
--set kubeProxyReplacement=true \
--set securityContext.capabilities.ciliumAgent="{CHOWN,KILL,NET_ADMIN,NET_RAW,IPC_LOCK,SYS_ADMIN,SYS_RESOURCE,DAC_OVERRIDE,FOWNER,SETGID,SETUID}" \
--set securityContext.capabilities.cleanCiliumState="{NET_ADMIN,SYS_ADMIN,SYS_RESOURCE}" \
--set cgroup.autoMount.enabled=false \
--set cgroup.hostRoot=/sys/fs/cgroup \
--set k8sServiceHost=localhost \
--set k8sServicePort=7445 \
--set prometheus.enabled=true \
--set operator.prometheus.enabled=true \
--set hubble.relay.enabled=true \
--set hubble.ui.enabled=true \
--set hubble.metrics.enableOpenMetrics=true \
--set hubble.metrics.enabled="{dns,drop,tcp,flow,port-distribution,icmp,httpV2:exemplars=true;labelsContext=source_ip\,source_namespace\,source_workload\,destination_ip\,destination_namespace\,destination_workload\,traffic_direction}"
--set hubble.metrics.serviceMonitor.enabled=true \
--set hubble.metrics.serviceMonitor.additionalLabels.release=prometheus \
--set=gatewayAPI.enabled=true \
--set=gatewayAPI.enableAlpn=true \
--set=gatewayAPI.enableAppProtocol=true > cilium-manifest.yaml
Apply the manifest by doing
kubectl apply -f cilium-manifest.yamlStep 3: Reboot the cluster
It will take some time to apply the configurations, so after waiting for a while we can reboot the cluster to apply the configurations.
talosctl --talosconfig talosconfig reboot -n 192.168.1.57,192.168.1.13And voila! We have Cilium installed and running in our cluster.
Step 4: Verify the installation
By default cilium will block all the traffic for all namespaces. So to mitigate this we need to add label to our existing namespace to allow the traffic.
kubectl label namespace pod-to-pod-communication pod-security.kubernetes.io/enforce=privileged --overwrite And after this we should see the traffic is working as expected!
Bottom line
- Is it worth it to use Cilium? Yes, it is! Even though it’s early days, it’s already a production-ready eBPF networking for Kubernetes. You won’t regret using it.
- Hubble is a great tool to help you monitor the network traffic and policy enforcement status.
- eBPF unlocks many new possibilities not only for Kubernetes networking but also for other areas like security, observability, and more.
All of these are available in my GitHub repository. I hope this guide helps you understand how eBPF and Cilium can supercharge your Kubernetes networking! If you have questions or want to discuss further, feel free to reach out on LinkedIn.