
If you’re building for the web, you’re probably using Chrome DevTools every day. But are you really making the most of it? Beyond inspecting elements and console logging, there’s a whole toolbox of features waiting to make your life easier. Here are 10 of my favorite DevTools tricks—some you might already use, others might surprise you.
Development Environment
- macOS: Sonoma 14.4
- Chrome: Version 137.0.7151.120
- Chrome DevTools: Version 137.0.7151.120
All keyboard shortcuts and commands in this article are for Mac. For Windows/Linux users, replace
CmdwithCtrlandOptionwithAlt.
1. Logpoints — Console Logging Without Touching Your Code
Ever wish you could add a console.log() without editing your source files? That’s where logpoints come in. Just right-click a line number in the Sources panel, select Add logpoint, and enter an expression like userId or {userId}.
DevTools will log that out every time it hits that line—no breakpoints, no code changes, and no risk of forgetting a stray console.log() in production.
Real scenario: You’re debugging a production bug where a specific function behaves inconsistently, but you can’t modify the code directly. You use a logpoint to track userId values every time the function runs—without ever touching the codebase.
How to add a logpoint:
- Open DevTools (
Ctrl+Shift+I/Cmd+Option+I). - Switch to the Sources panel.
- Right-click the line number you want to trace.
- Choose Add logpoint….
- Type your expression (e.g.
{userId}) and hit Enter. - Watch the Console for logs every time that line executes.
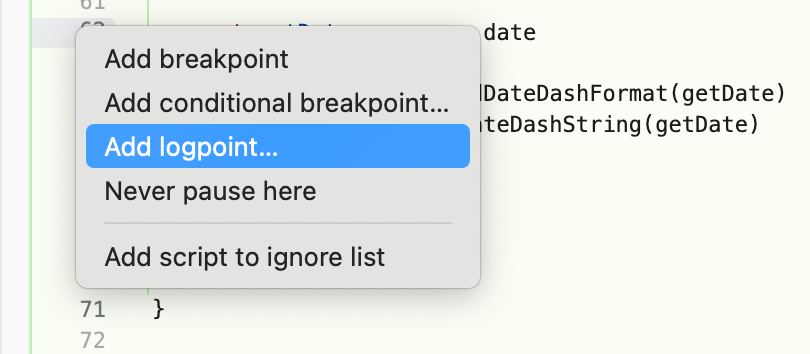
Adding a logpoint in Chrome DevTools Sources panel

2. Force :hover, :focus, and :active States
Need to style a hover dropdown but can’t keep your mouse still and inspect at the same time? Select an element in the Elements panel, hit the :hov button, and force :hover, :focus, or :active states.
It’s a small thing that saves tons of time tweaking CSS.
Real scenario: You’re building a navigation bar with dropdowns that only appear on hover. Instead of constantly hovering and trying to inspect them, you toggle :hover to keep the menu open and style it easily.
How to force element states:
- Open DevTools → Elements panel.
- Click the element you want to test.
- In the Styles sidebar, click
:hov. - Check
:hover,:focus, or:activeto lock that state.
3. Rendering Panel — Visual Debugging for Performance
Want to know what’s causing that annoying flicker or layout jump? Open the Rendering tab under More Tools. Here, you can:
- Flash paint areas to see what’s repainting
- Highlight layout shifts
- Enable the FPS meter to monitor jank
It’s like x-ray vision for your front-end performance.
Real scenario: After deploying a new feature, you notice janky scrolling on a product list. You enable paint flashing and find that the entire list is repainting on scroll—turns out it’s caused by animating top instead of using transform.
How to open the Rendering panel:
- Open DevTools and press
Ctrl+Shift+P/Cmd+Shift+P. - Type Rendering and select Show Rendering.
- In the newly opened Rendering tab, toggle:
- Paint flashing
- Layout shift regions
- FPS meter
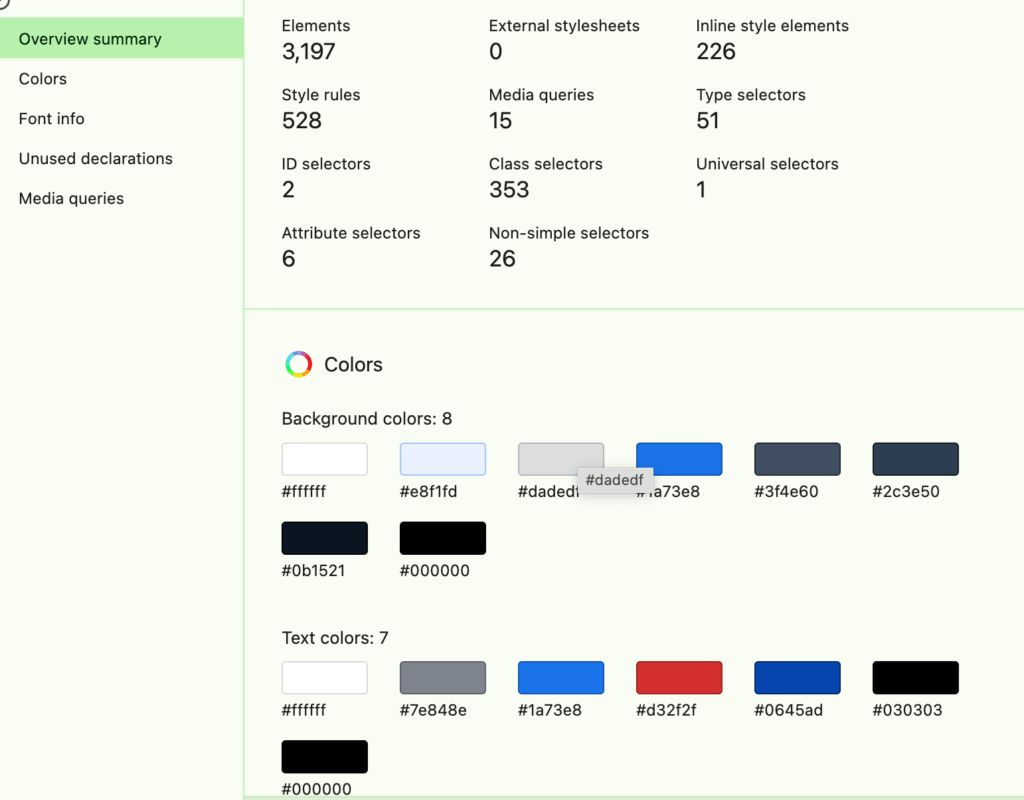
4. CSS Overview — Audit Your Styles in One Click
This one’s a hidden gem. Head to More Tools > CSS Overview, hit Capture overview, and DevTools will give you:
- All colors used (great for finding near-duplicates)
- Font usage
- Media queries
- Unused CSS declarations
Super helpful when cleaning up a messy codebase or trying to get a grip on someone else’s styling.
Real scenario: You’ve inherited a legacy project and want to standardize the design system. Running a CSS overview shows there are 7 different shades of gray being used—you consolidate them into 2 and clean up redundant rules.
How to capture a CSS overview:
- Open DevTools → click the ⋯ (More tools) menu.
- Select CSS Overview.
- Click the Capture overview button.
- Inspect the generated report for colors, fonts, media queries, and unused rules.
5. Animations Panel — See It, Scrub It, Tweak It
If you’re working with CSS transitions or animations, the Animations panel is a must. It records running animations, lets you scrub through them frame-by-frame, and adjust timing live.
Perfect for fine-tuning those micro-interactions without doing a full reload.
Real scenario: Your designer says the button’s hover animation feels too fast. You record it in the Animations panel, slow it down with the scrubber, and instantly see how increasing the duration to 300ms improves the UX.
How to use the Animations panel:
- Open DevTools → ⋯ → More tools → Animations,
or pressCtrl+Shift+P/Cmd+Shift+Pand type Show Animations. - Trigger the animation on the page.
- In the Animations panel, use the scrubber to pause, rewind, and adjust playback speed.
6. Coverage Panel — Find What’s Not Being Used
Performance tip: not all code that loads gets used. Open the Coverage tab (Cmd/Ctrl+Shift+P > Show Coverage), reload your page, and DevTools will show you how much of your CSS and JS is actually used.
Seeing lots of red? Time to clean house.
Real scenario: You’re optimizing your landing page and discover that a large portion of your bundled CSS (from a third-party UI library) isn’t even used. You remove the unused styles and reduce load time by 200ms.
How to run a coverage report:
- Open DevTools →
Ctrl+Shift+P/Cmd+Shift+P. - Type Coverage and select Show Coverage.
- Click Reload in the Coverage panel to start.
- Review green (used) vs red (unused) bytes for CSS and JS.
7. Snippets — Saved Scripts for Everyday Tasks
Tired of typing the same script into the Console over and over? Save it as a Snippet under the Sources tab.
For example:
document.querySelectorAll('img').forEach(img => console.log(img.src));
Real scenario: You’re QA testing a content-heavy page and want to verify that all image sources are valid. A saved snippet logs all image URLs in one click, and you quickly spot a couple of broken links.
How to create and run a snippet:
- Open DevTools → Sources panel → Snippets tab.
- Click New snippet, paste your code, and name it.
- Right-click the snippet → Run, or press
Ctrl+O, type!snippetName, and hit Enter.
8. Performance Panel — Dive into the Flame Chart
Hit record, interact with your page, and stop. DevTools will give you a detailed breakdown of:
- JavaScript execution
- Rendering and paint times
- Layout shifts
It also shows Core Web Vitals like LCP and CLS in real time. Great for catching long tasks or layout thrashing.
Real scenario: A user reports laggy performance when submitting a form. You record a profile and discover a blocking task that delays input responsiveness by 500ms. Optimizing that function makes the UI feel instant again.
How to profile with the Performance panel:
- Open DevTools → Performance tab.
- Click the Record button.
- Perform the actions you want to measure.
- Click Stop; explore the flame chart for JS, rendering, and Core Web Vitals metrics.
9. Network Throttling & User-Agent Switching
Testing on fast Wi-Fi is nice, but what about users on 3G? Or mobile Safari?
In the Network panel, you can simulate slow connections and override your user agent. This way, you’re not just building for you—you’re building for everyone.
Real scenario: Your image-heavy homepage loads fine for you, but customers complain on mobile. With “Slow 3G” throttling enabled, you see the load time jumps to 8+ seconds. You decide to lazy-load images below the fold to fix it.
How to throttle and change UA:
- Open DevTools → Network tab.
- From the Online dropdown, choose Slow 3G or Fast 3G.
- To override the UA:
Ctrl+Shift+P/Cmd+Shift+P→ Show Network conditions → uncheck “Use browser default” → select a User-Agent string.
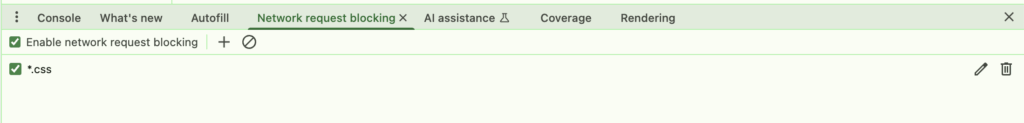
10. Request Blocking — Simulate Outages or Clean Views
Sometimes you want to see how your app behaves without a stylesheet, script, or third-party request. Use the Request Blocking panel to stop specific files from loading.
Useful for testing fallbacks, offline behavior, or just decluttering the view when debugging.
Real scenario: You want to test how your app looks when a CSS file fails to load. You block main.css in DevTools, reload the page, and verify that your fallback styles are applied correctly.
How to block requests:
- Open DevTools → Network panel.
- Click ⋯ (More tools) → Request Blocking.
- In the Request Blocking sidebar, click Add pattern, enter the URL or filename (e.g.
main.css). - Reload to test with that resource blocked.
Final Thoughts
DevTools is more than just Inspect Element and Console—it’s packed with features to help you build better, faster, and more reliable web experiences.
Hopefully, you discovered at least one new trick here. If you did, share this with your team or keep it bookmarked for your next debugging session.