
A bit about me
I’m Takudai Kawasaki, a backend and reliability engineer at Money Forward. I’ve spent more than three years building and running financial platforms, from getting new launches stable to handing them over to operations. You can find me on LinkedIn or X.
DevOps work never feels done
With feature work, I usually know when I’m done. There’s a deadline, a release, or something a user can actually use. DevOps work has never felt like that to me. I could put real time into monitoring or tests, or into how we develop, and still not be able to say what had improved. Some weeks I was busy the whole time and still felt stuck.
We’re a small team looking after three products. On top of feature work, we check each other’s changes and keep track of operational and security issues. A lot of that ongoing work came down to manual checks and fuzzy “improvements”. I wanted it to be repeatable, and I wanted to be able to see it.
I should say up front that I didn’t build an AI platform for this. Everything here runs on preview infrastructure we already had and AI tools that are shared across teams. AI suggested implementations and helped with the analysis; my part was noticing the gaps in our workflow and building habits around them.
The piece I use most is a curl-based Claude Code skill that tests a running app in a preview environment before merge. (A skill is a packaged set of instructions and scripts that Claude Code loads when a task calls for it.) We also run AI-assisted daily shift checks, where the engineer on duty reviews monitoring and security signals. And I started a monthly DevOps baseline so we can see where to improve.
Testing before merge
Some of our checks used to be possible only after merge, in a shared sandbox environment. If you wanted to see how the app behaved with your change, you had to merge first. Not great when the change is still in review.
We had automated tests and continuous integration (CI). The gap was anything that needs a running app, like a login session or a chain of API calls where each call depends on the one before.
Preview environments changed that. A preview is a short-lived deployment built from a pull request’s code. I can test the change on a running app while the pull request is still open, instead of waiting for the sandbox.
I start with kubectl: is the pod up, and is it running the pull request’s latest commit? After that I set up whatever session the scenario needs and call the endpoints. The preview gives you a running app, but knowing what should happen is still your job.
A word of caution: a preview isn’t always a fully isolated copy of the system. Some backing services and test data are shared, so anything you write during a check might still be there for the next person. Know what your requests can touch before you automate them.
None of this replaces unit tests, integration tests, or code review. It just means we get to see the running app sooner.
Turning the session setup into a skill
Even with previews, session-based checks were tedious. Every time, I’d log in, look up the endpoint, dig the session cookie out of the browser, and build the next request by hand. I usually knew exactly what I wanted to test. It was the setup I kept redoing.
So I turned the repeatable part into a curl-based skill. It lives in our GitHub repository, and the whole team uses it for preview checks now. Its first lines sum it up better than I can: “Getting a session is the whole problem. Everything after it is ordinary curl.”
Rather than copying a session out of the browser, the skill sets up a short-lived test session automatically, uses it for the curl requests, and removes it at the end. It also refuses to run anywhere except a preview environment. The guard is two checks, simplified here from the skill’s session script:
# Refuse anything that is not a pull request preview, before any kubectl call.
if ! [[ $namespace =~ ^my-app-preview-[0-9]+$ ]]; then
  echo "refusing: '$namespace' is not a preview namespace." >&2
  exit 2
fi

# A namespace name alone doesn't say which cluster it resolves in, so check the context too.
ctx=$(kubectl config current-context)
if ! [[ $ctx =~ (^|[:/])dev$ ]]; then
  echo "refusing: kubectl context '$ctx' is not the development cluster." >&2
  exit 2
fi

# Pin every later call to the context that passed, even if someone switches contexts mid-run.
k() { kubectl --context "$ctx" "$@"; }
Both are allowlists: the script runs only where it recognizes a preview. A denylist like “refuse anything containing prod” would miss a production cluster that happened to be called live-main.
These checks are guardrails against slips, not a security boundary. A context name is only a local alias, so a context called dev could point at any cluster. The real script also checks the API server the context points to and pins it on every call. For a hard boundary, give the script credentials that only work on the development cluster.
What the AI agent running the skill can’t do is tell you the change is correct. Sending requests is easy. Somebody still has to know what the response and the data should look like, and then check them. Here’s one run (sanitized) from a pull request that changed the format of files generated by an API endpoint:
kubectlshowed the preview pod running the pull request’s latest commit, and the same pod served every request in the run.- The skill created a short-lived session for a test user. One request set that user’s saved date range so it covered seeded test data.
- The actual call returned
200, a file name, and a download link. - Then the real check. The file started with a UTF-8 byte order mark (BOM) and used Windows-style line endings (CRLF, carriage return + line feed) all the way through. The number of data rows matched the database, and every row had as many columns as the header.
- The application log showed the file being generated, with no warnings or errors.
- Finally, the skill restored the date range and deleted the session. The report also listed what the run couldn’t test and which test data it had changed.
That 200 in step 3 would look exactly the same if the file were broken. Steps 4 and 5 are the verification; everything else is setup and cleanup. I ran it with the agent, posted the evidence on the pull request, and then the reviewer and I both went through it.
Some checks can’t use a prepared session: signing up, a first login, or an emailed one-time password (OTP). For those, the skill stops and hands the step back to you. It links the preview’s login page and test inbox, lists the steps, and says what to paste back so the curl run can continue.
Daily shift checks, with a person in charge
Our daily operational checks had the same problem. Whoever was on duty had to go through several tools: Datadog dashboards and application performance monitoring (APM) anomalies, dependency-vulnerability alerts on GitHub, and Cloudflare firewall warnings or other signs of suspicious access. With three products, you’d be jumping between tools for a while before you could even decide what needed attention.
These days the checks run on an internal AI agent platform that several teams share, and everyone on our team is in the rotation.
I also extended the security check so it opens tracking tickets for dependency advisories. It looks for an existing ticket first, and it reports back when it can’t finish. (A ticket is nice for tracking, but the vulnerability is still there until someone fixes it.)
The AI doesn’t resolve incidents or merge anything by itself, and it won’t catch every security issue. The one rule I’m strict about: if a source couldn’t be checked, the report says so. I’d much rather see a gap reported as a gap than get an “all clear” that isn’t.
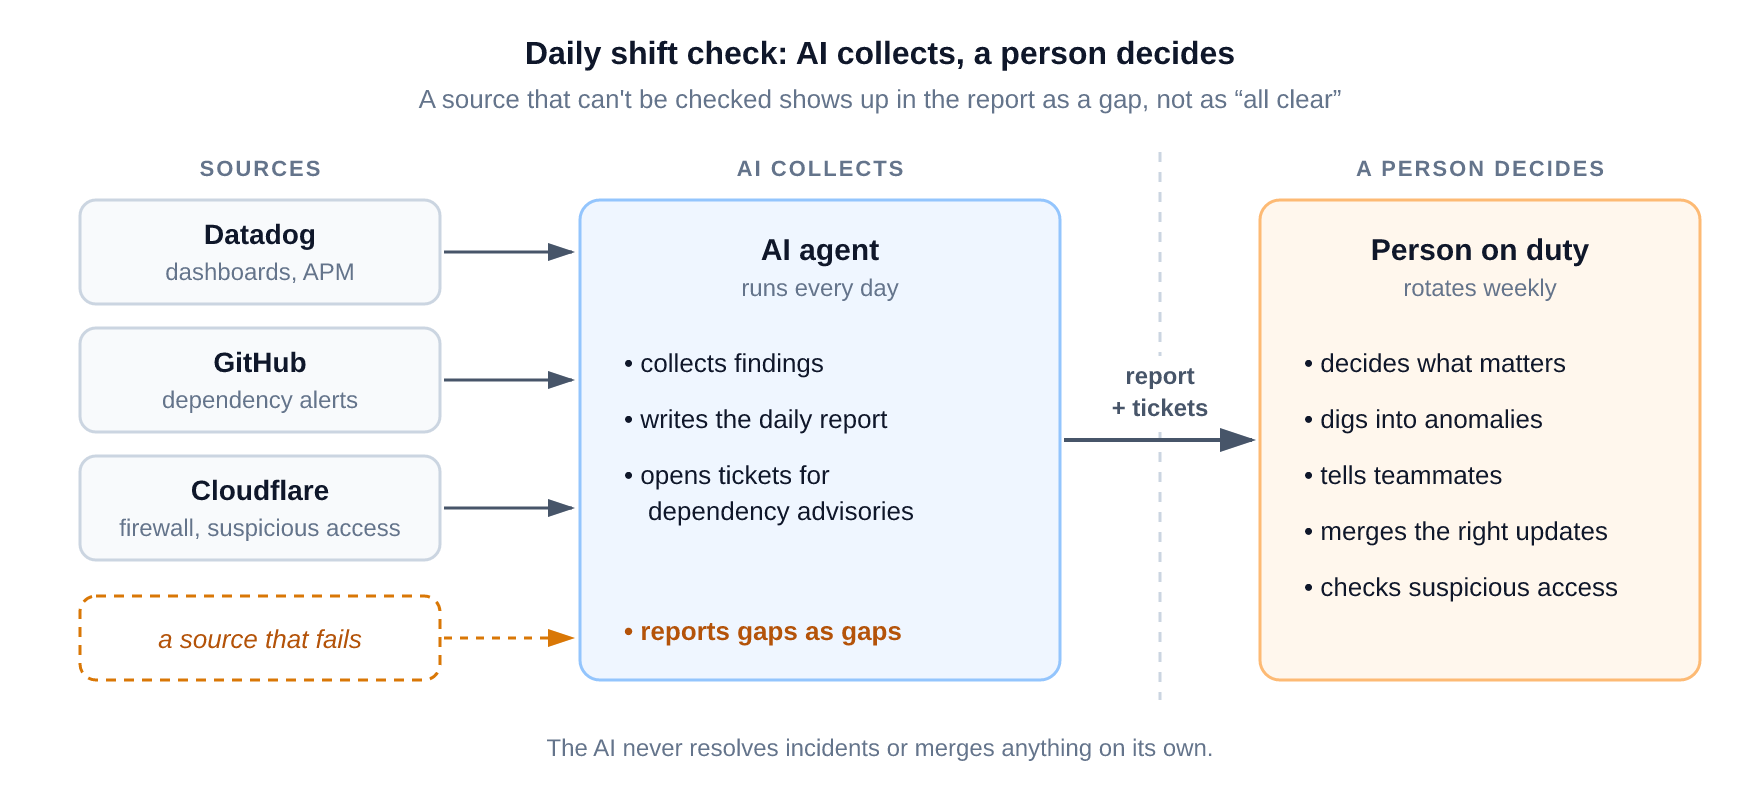
Day to day, we spend less time clicking through Cloudflare, Datadog, and GitHub for the same kinds of information, and more time investigating what turns up (or doing other engineering work).
A monthly baseline
Daily checks are about today. I also wanted some sense of how our development process was doing over time.
I knew about the DevOps Research and Assessment (DORA) metrics but had never tracked them consistently. With a small team and fairly new products, I didn’t want to start with a big framework. I just wanted to know where we stood, and then decide what was worth improving.
I started with deployment frequency and with seeing where time goes in our workflow. The data comes from Datadog, our GitHub release and deployment pull requests, and the Slack reports from Findy Team+ (an engineering-productivity analytics service).
Splitting the path into stages (commit, pull request, first review, approval, merge) gives us better questions. Where is work sitting? Is the delay in implementation, in review, or at the final merge? Is this what a typical change looks like, or are a couple of long-running pull requests dragging the numbers?
For one of our backend services, waiting for the first review was the longest stage in every weekly Findy Team+ report covering October, with weekly figures of roughly 22 to 41 hours. That doesn’t tell us why yet, but it tells us where to look first.
I call it a “DORA-informed” baseline on purpose. DORA’s lead time for changes runs from commit to production, and our headline number, a pull request’s open-to-merge time, covers only part of that.
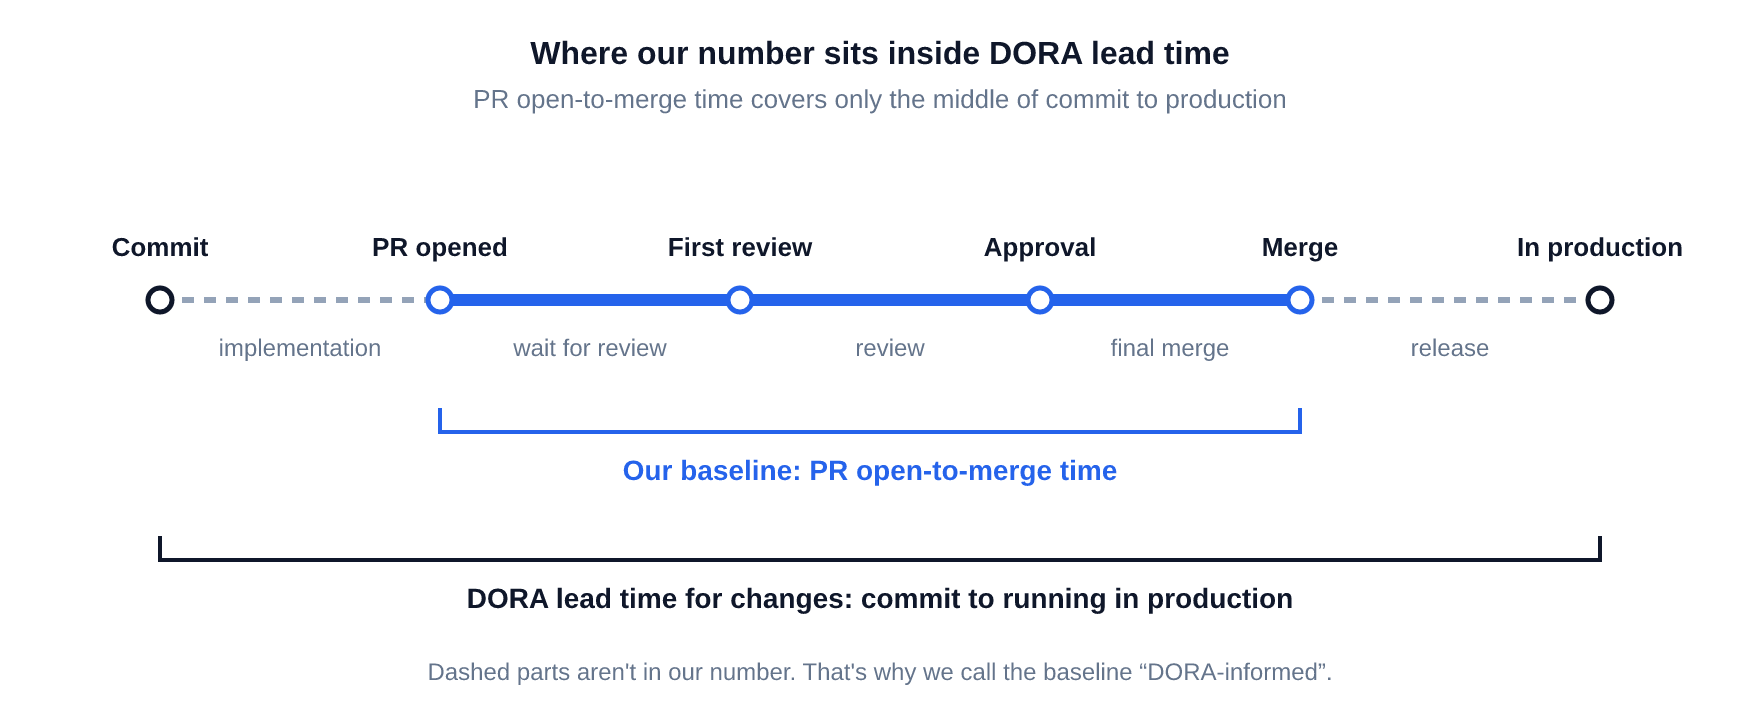
I scheduled the baseline report in the Claude desktop app to run on the first of every month, so when we pick targets, we have somewhere to start.
When the report looks too clean
AI helped produce these reports. It also caught some of the mistakes in them and helped fix them, so I can’t take the credit for those. What working on them taught me is that collecting data and comparing it properly are two separate jobs.
It’s surprisingly easy to get the comparison wrong. Repeated notifications or duplicate monitors can make one problem look like several incidents. Missing data looks a lot like a good result. A merged pull request isn’t a production deployment. And two timings that come from different clocks or filters can’t really be compared directly.
In August, one staging monitor sent 167 of our 325 alert notifications. It was really one or two long-running problems, re-sent every hour. After we retuned it, and a few other noisy monitors went quiet, alerts fell to 102 in September and 28 in October. That drop means the monitors got quieter, not that we had fewer problems.
We hit the missing-data problem too, in one of our alert counts. The query filtered by environment, so it could miss any monitor whose alert events didn’t carry the expected environment tag. We’ve since merged a config change that adds the tag to those monitors, but it stuck with me: a clean report can just mean the query left something out.
So I try to stick to a few rules now: say where the data came from and how it’s defined, keep the gaps visible, and check the result before deciding what to do next. AI makes that easy enough to do every month. Actually following the rules is still on me.
Is AI making our changes less stable?
There’s one question this post doesn’t answer yet, and it might be the most important one: is AI making what we ship worse?
DORA’s research is a good reason to take that seriously. In the 2024 report, a 25% increase in AI adoption was associated with 1.5% lower delivery throughput and 7.2% lower delivery stability. That’s a correlation, so it doesn’t prove AI caused the drop, but it’s hard to ignore. By the 2025 report, the link to throughput had turned positive, but AI adoption was still tied to lower stability. DORA describes AI as an amplifier: it magnifies whatever strengths and weaknesses a team already has.
The lesson I take from that is to pair AI with strong tests, small changes, and review gates. Looking back, the preview checks and the “a person decides” rule in this post are exactly that kind of guardrail.
Still, I’d rather answer the quality worry with our own data than with a feeling. Almost all of our team’s code is written with AI now, so there’s no human-only group to compare against. Instead, I want to track rework, rollbacks, and bugs that reach users over time, grouped by change size so a few big pull requests don’t skew the picture.
Where things are now
I’ve noticed the team paying more attention to release frequency and to getting our monitoring into code. Monthly production deployments across our three products rose from 4 in July to 5, 9, and then 12 in October, counted the same way each month. I can’t say how much of that the baseline caused, but it’s the first trend I’ll keep watching.
The Slack threads where we share the reports have also turned into real follow-ups: someone asking whether a fix had reached another service, the monitor-tagging work getting assigned, people chasing a ticket that was still open.
The shift checks seem to help too, but we haven’t timed what they save or set a deployment-frequency target.
Release verification isn’t finished either. We’ve written go/no-go criteria, but we don’t yet record the checks and the decision as part of every release. Automating that record-keeping is next. The go/no-go call itself will stay with a person.
Making your own finish line
Going back to where I started: feature work comes with a finish line, and ongoing DevOps work mostly doesn’t. So you have to make your own. Show where things stand, pick one specific problem, and decide what “better” would look like for it.
Where AI helped me most was the mechanical part: pulling information together, flagging what needs a look, and repeating the same steps every time we check a system. You don’t need AI for all DevOps work. For me, though, it’s what made these habits possible to keep up.
I was hoping to end this post with a number that proves it worked. I don’t have that yet. What we do have is a way to verify changes before they merge, checks we can reuse, and a much better idea of where we need to improve. Next, we’ll pick one target and measure it with numbers we actually trust. If that works out, maybe the next post will have the number.